Get to Know the Bullish Reversal Pattern, What About It?

ABCD shares are already down 50% from their peak.
XWYZ stock is consolidating healthy after a downtrend.
Most people's question: When do stock prices rebound after a downward trend? So one thing you can know is the formation of a reversal pattern .
Before we get into the reversal pattern , you must know about the price movement phase first.
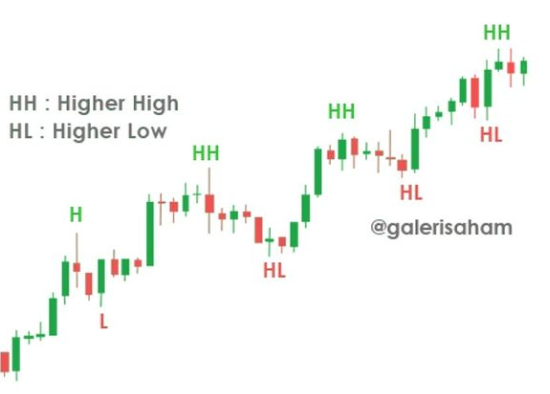
Remember that the phases of stock movement are divided into 3, namely uptrend , downtrend and consolidation. The uptrend phase is when the stock price moves to form Higher High (HH) Higher Low (HL) as shown in the example below.
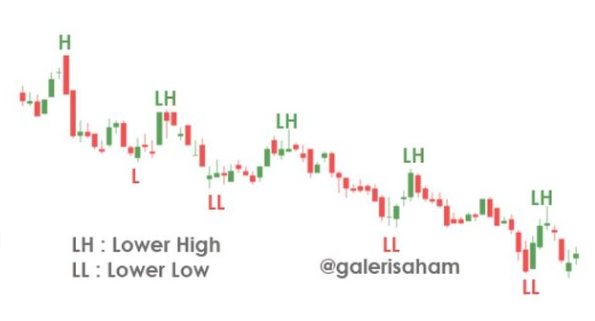
The second is the downtrend phase which can be seen in the picture below. Stock movement will be said to be downtrend when it forms Lower High (LH) Lower Low (LL).
The last is the consolidation phase. This phase occurs if the movement of the stock price is not going anywhere. Does not form HHHL or LHLL. So, usually when a stock is in the consolidation phase, it forms a pattern, which describes the psychology of all market participants.
This time we will discuss a consolidation of the reversal type , namely a bullish reversal . When a trend reverses from downtrend to uptrend , the change in trend does not occur suddenly, but consolidates first. So that's when the reversal pattern is formed
Here we will discuss patterns that appear frequently, such as Inverted Head & Shoulders, Double Bottom, and Cup & Handle.
How do these patterns look?
1. Inverted Head & Shoulder
Head & Shoulders. Have you heard this word? Maybe you think Head & Shoulders is a shampoo brand. So it turns out that in technical analysis there is also what is called Head & Shoulders.
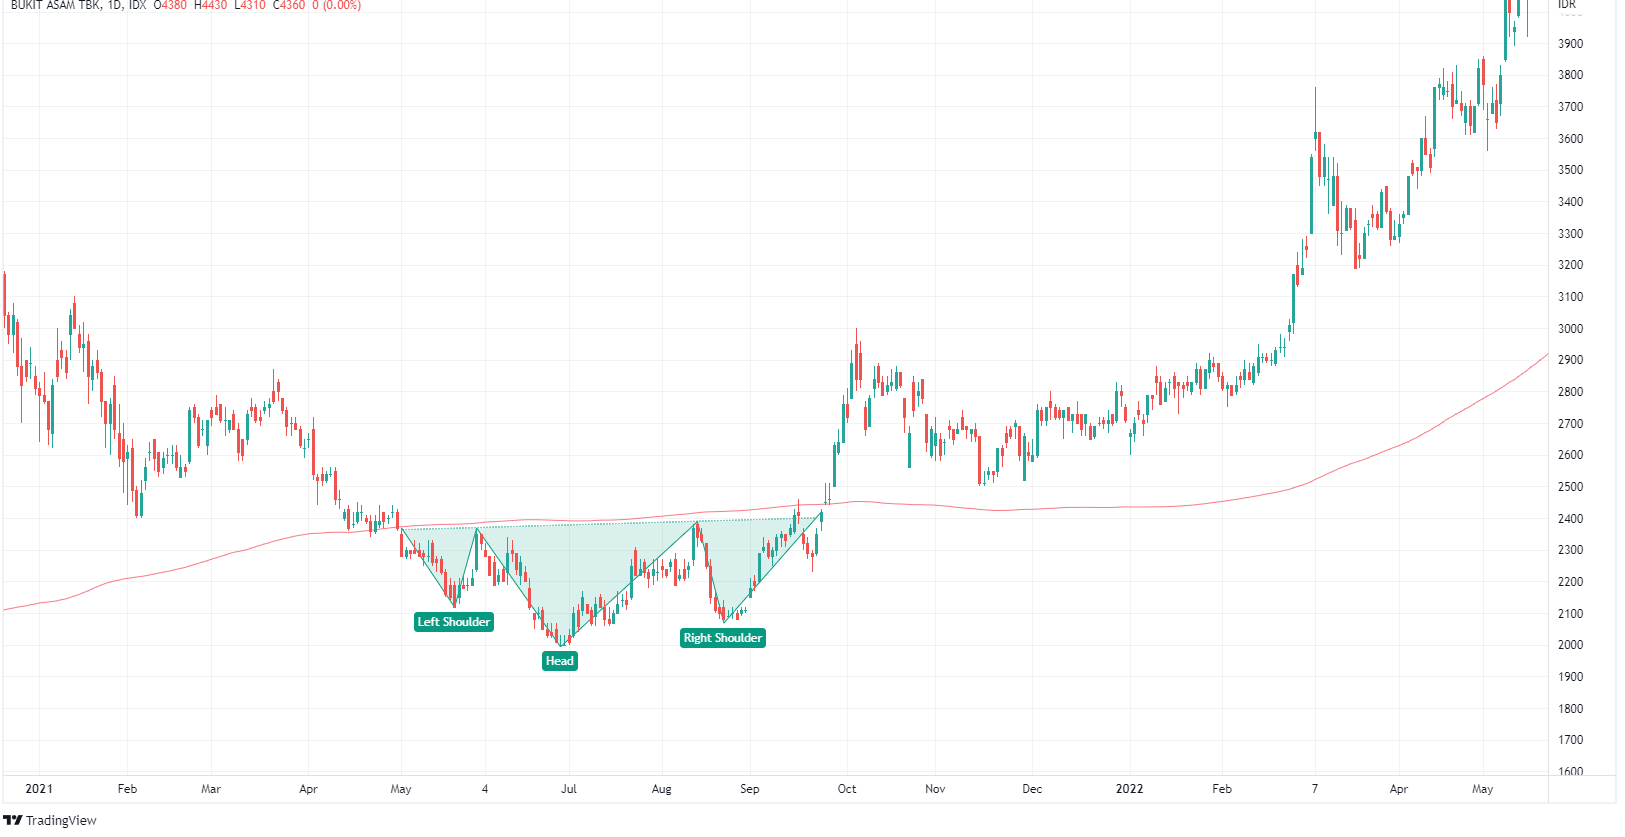
As an example of the PTBA stock chart above, after experiencing a downtrend , PTBA consolidated to form an Inverted Head & Shoulders pattern . Why is it called that? Because if we see, this pattern forms 2 shoulders, right and left (on the left and right shoulder ), as well as the head (the head ). And the position was reversed. After the Inverted Head & Shoulders pattern occurred and managed to penetrate the neckline at 2380, the price movement reversed, from a downtrend to an uptrend .
2. Double Bottom
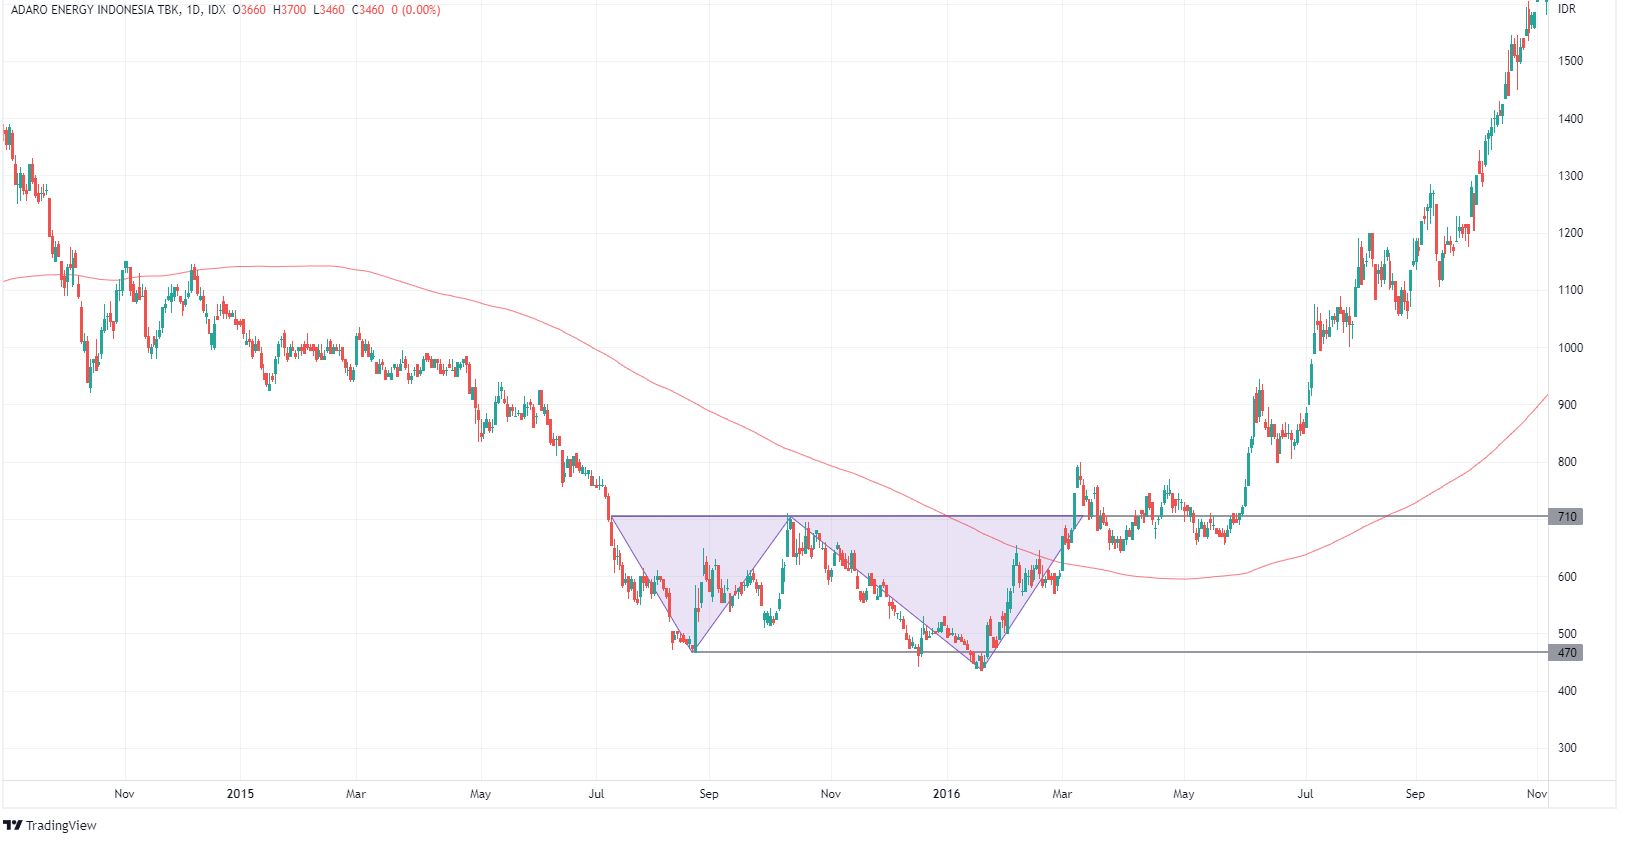
The next consolidation pattern is the Double Bottom. Just like the Inverted Head & Shoulders, this pattern occurs when price movements consolidate after a downtrend (check the chart above). The pattern occurs when testing the same support area (area 470) 2x before returning to the resistance. After the Double Bottom occurred, the price direction reversed to become an uptrend .
3. Cup & Handle
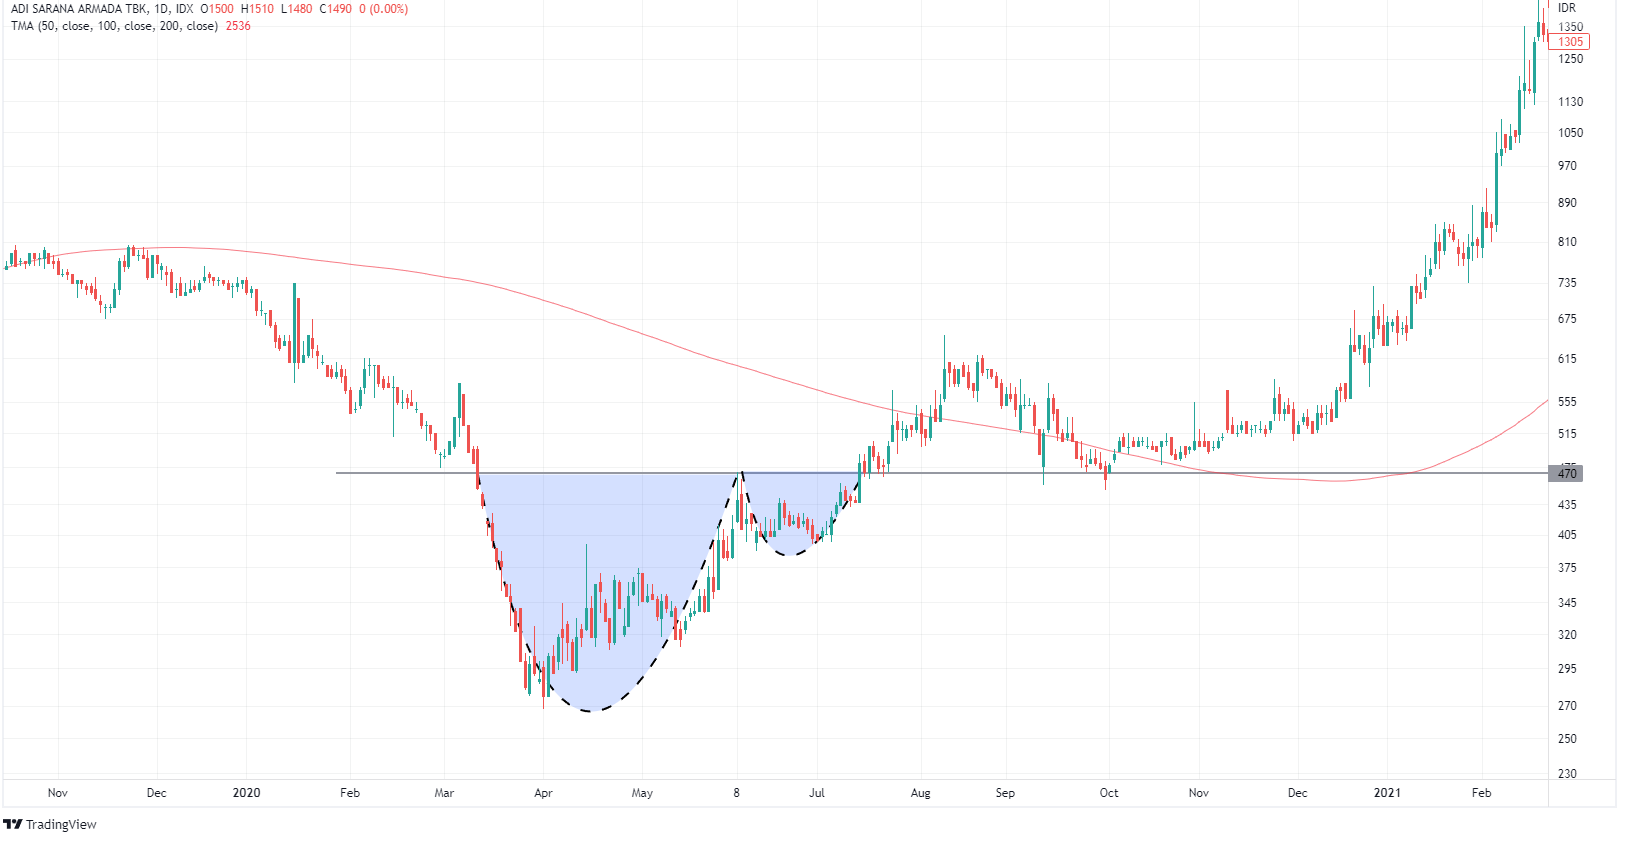
Well, you already know what reversal patterns are, right? If you are a technical analyst, which pattern do you see more often?
Posting Komentar untuk "Get to Know the Bullish Reversal Pattern, What About It?"