Moving Average Functions You Should Know Before You Trade Using This Indicator
After we learn about the differences between the Simple Moving Average (SMA), Exponential Moving Average (EMA), and Weighted Moving Average (WMA) whose articles you can read here , the next question is what is the function of the moving average ? Is it to determine the trend direction of a price? Or for buy and sell points?
As we know, this moving average indicator has been widely used by traders around the world. Even some big investors also use it.
What are the benefits of this indicator? Let's try to discuss 3 functions of the moving average indicator
1. To determine the trend direction of a price
The first moving average function is to help us determine the current trend. Here we will use a series of MAs, namely MAs 50, 100 and 200. Why use these 3 MAs? Because MA 50 is for reading short-term trends, MA 100 is for reading medium-term trends and MA 200 is for reading long-term trends.
The stock price is in an uptrend phase
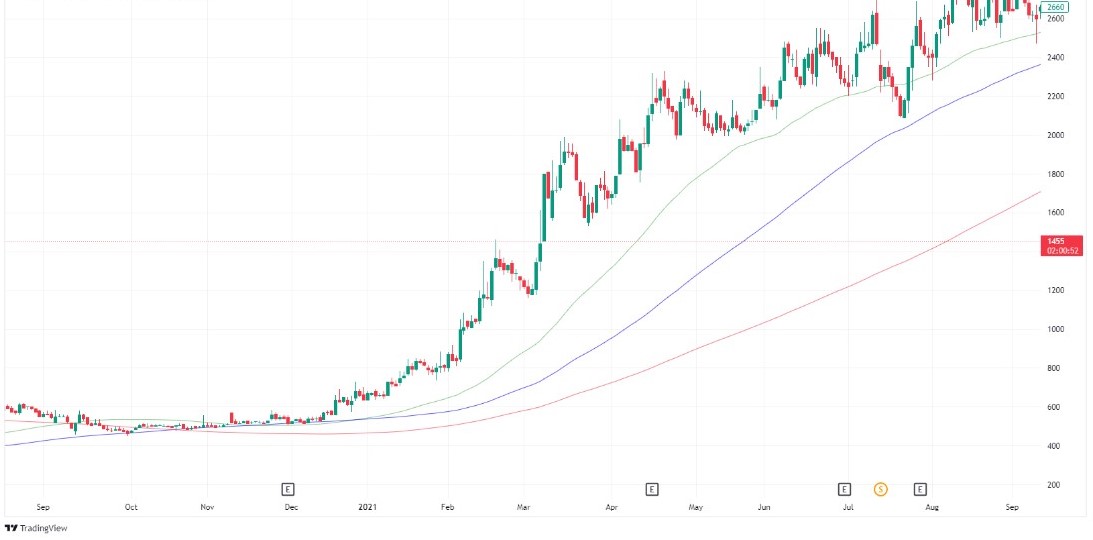
If the price movement is above the MA series, then the MA series are neatly arranged (starting from 200 red-100 blue-50 green), indicating that the current trend is a strong uptrend . That way we can conclude the trend that is happening is an uptrend, both short term and long term.
Price is in Downtrend Phase
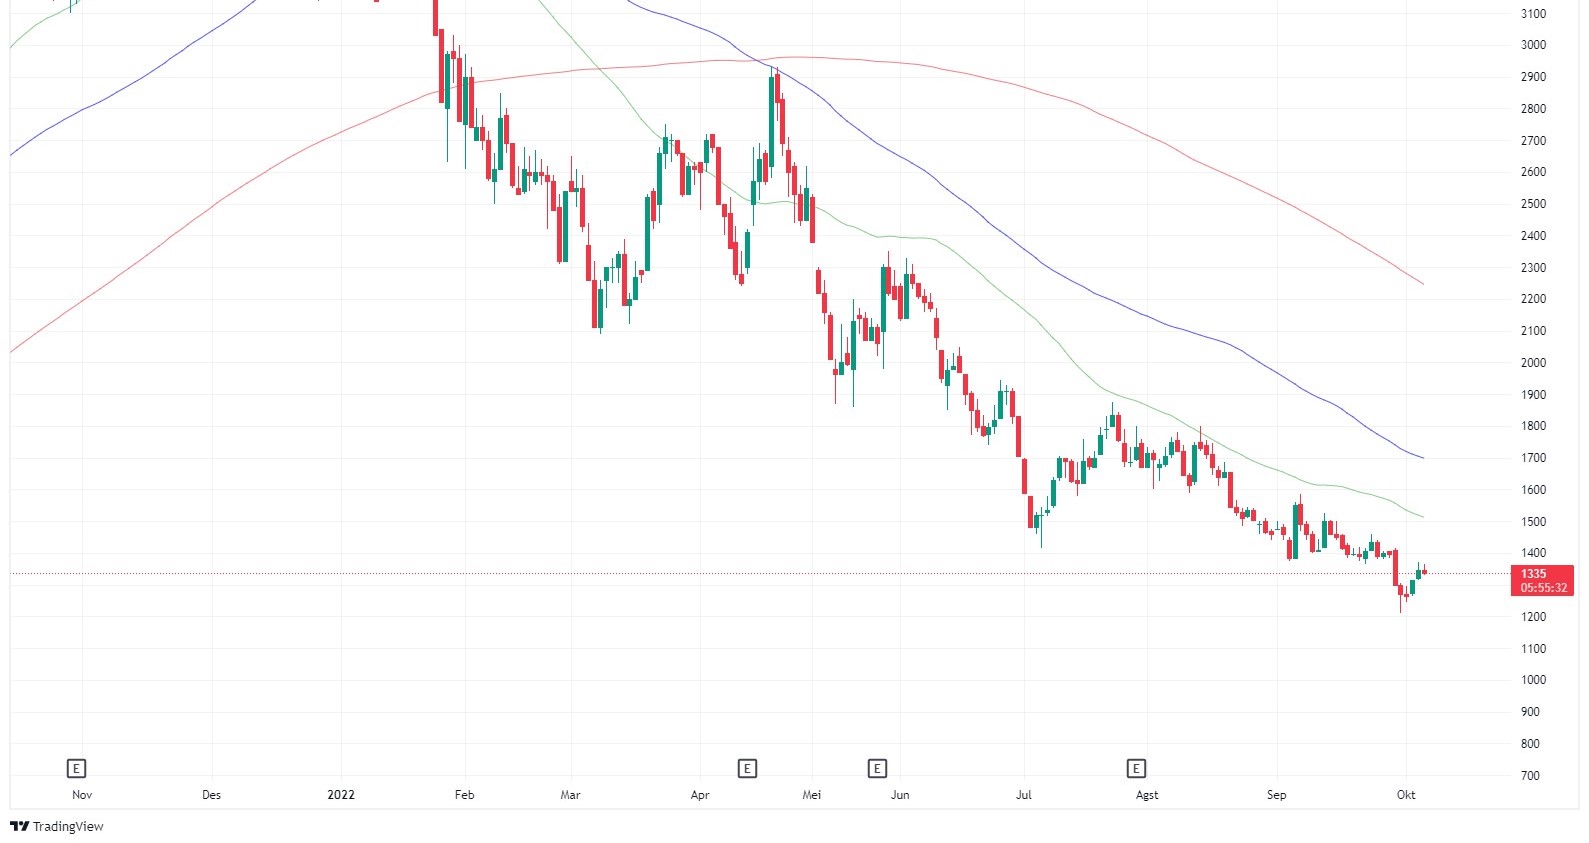
Conversely, if the price moves below the series of MAs, then the MAs are neatly arranged downwards, meaning that the price is in a strong downtrend phase (as shown in the chart above). If you find a stock like this, it's better to avoid it because as long as it's below the MA series, the chance to go down is greater than the chance to go up.
Prices in Sideways / No Trend Phase
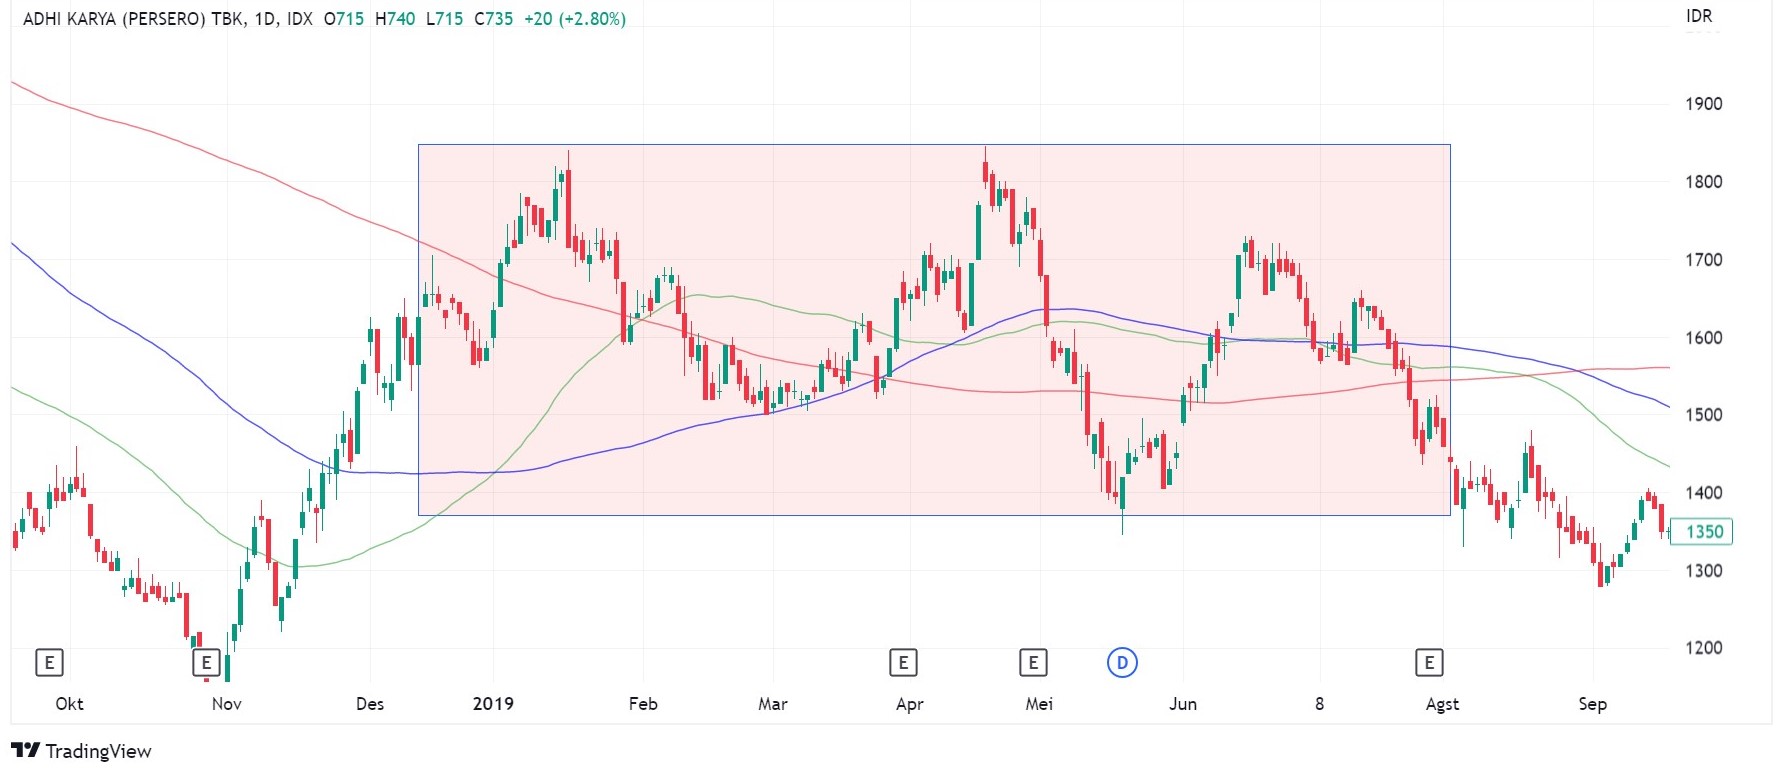
So how about the sideways phase ? The sideways phase occurs which is marked by a series of MAs that have a random, horizontal arrangement, and price movements often experience false breaks .
The chart above is an example when a stock is in a sideways phase ( red box ). It can be seen that the series of MAs are not neatly arranged and that price movements often experience false breakouts around these MAs.
2. As a Price Barrier , aka Support and Resistance
The second function is that the moving average will act as support or resistance. What's the example like?
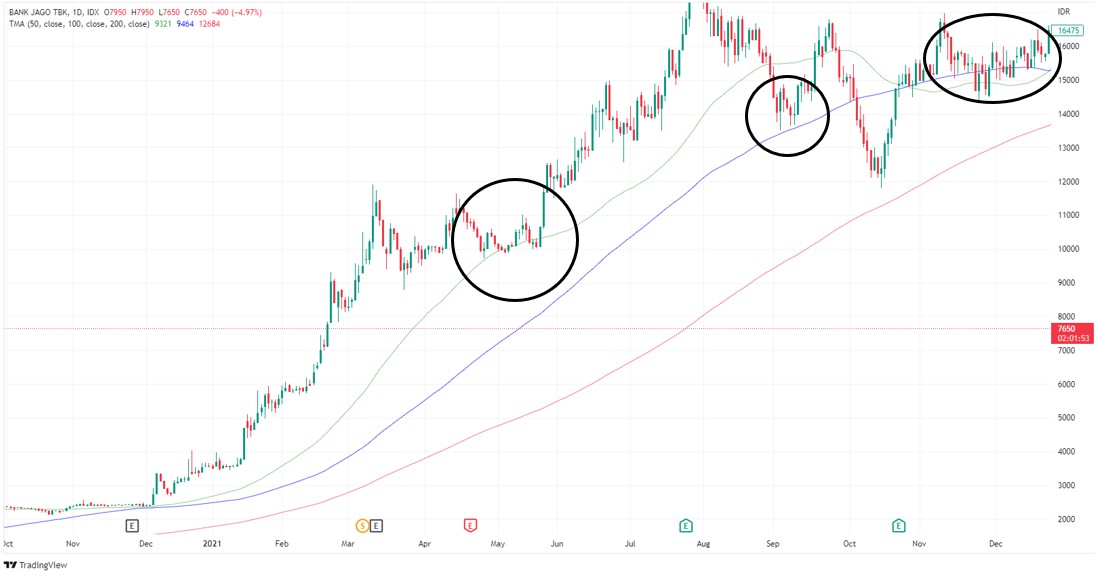
When price movements experience a strong uptrend , the MA series will act as support which will prevent further price declines if a correction occurs. The stock in the figure is in an uptrend , therefore when the stock price is undergoing technical correction , this MA will function as a resistance to decline ( support , check for black circles).
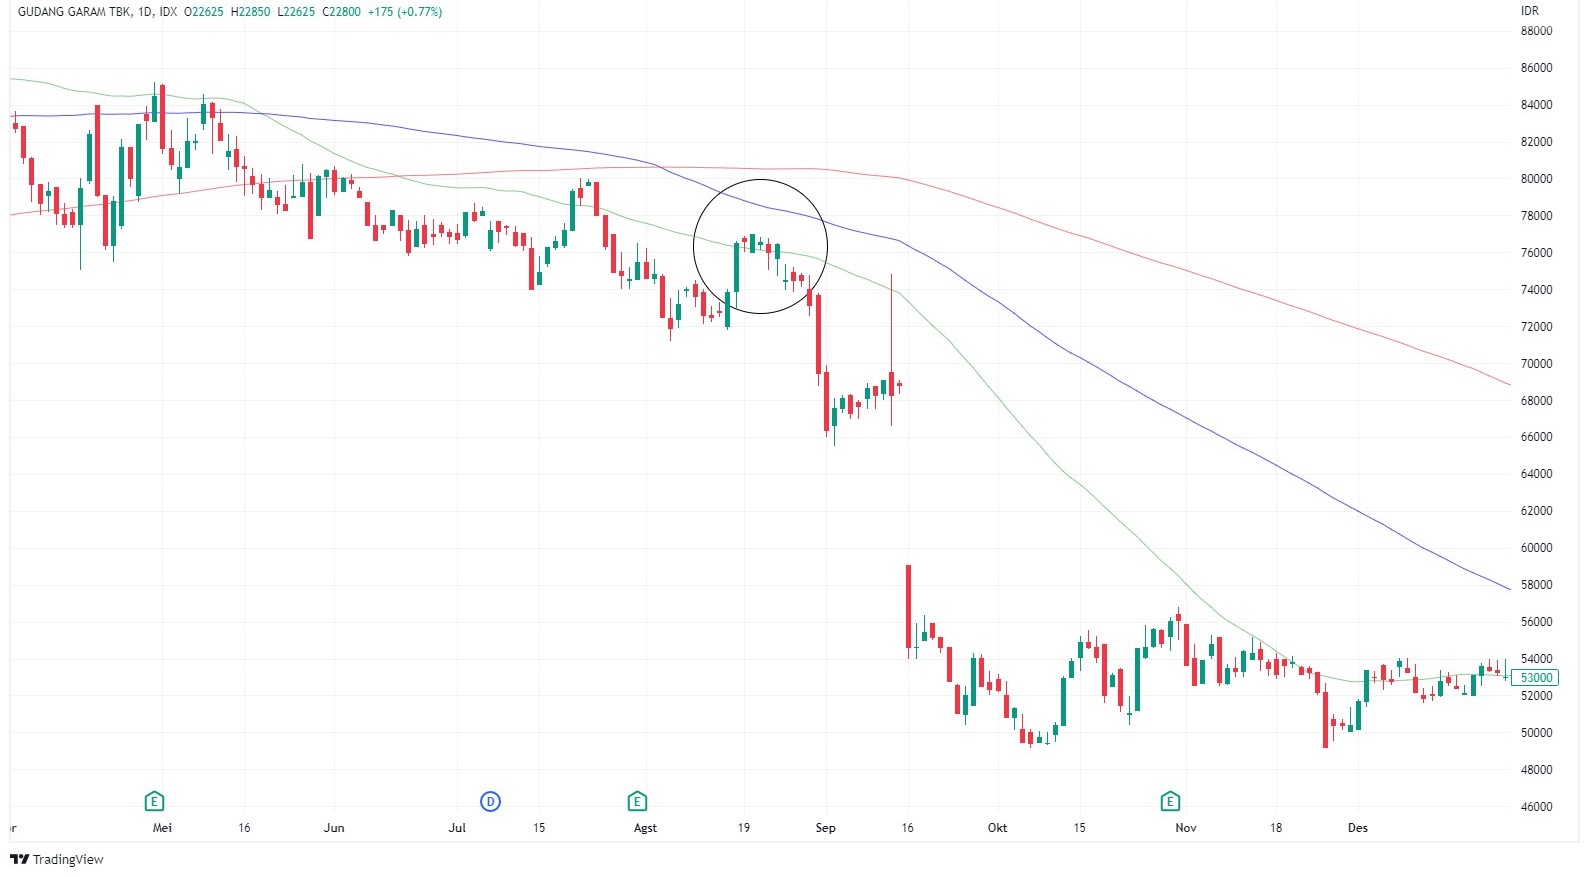
Conversely, when the current trend is a downtrend , the MA series will act as resistance which will hold back the price increase (you can check the chart above). The stock price moves below a series of well-arranged MAs. When the stock rebounds , the MA will function as a barrier to the increase (black circle), so it is very natural for the stock price to experience rejection and continue the downtrend .
FYI, if the MA is successfully penetrated, the MA will change its role. Support will become resistance and resistance will become support .
3. As a signal to buy or sell
The function of the last MA is to give us a signal to buy or sell. How to determine? That is, when the price manages to penetrate the MA upwards, this is a buy signal. Conversely, if the MA is successfully penetrated when the price drops below, this is a sell signal. What's the example like?
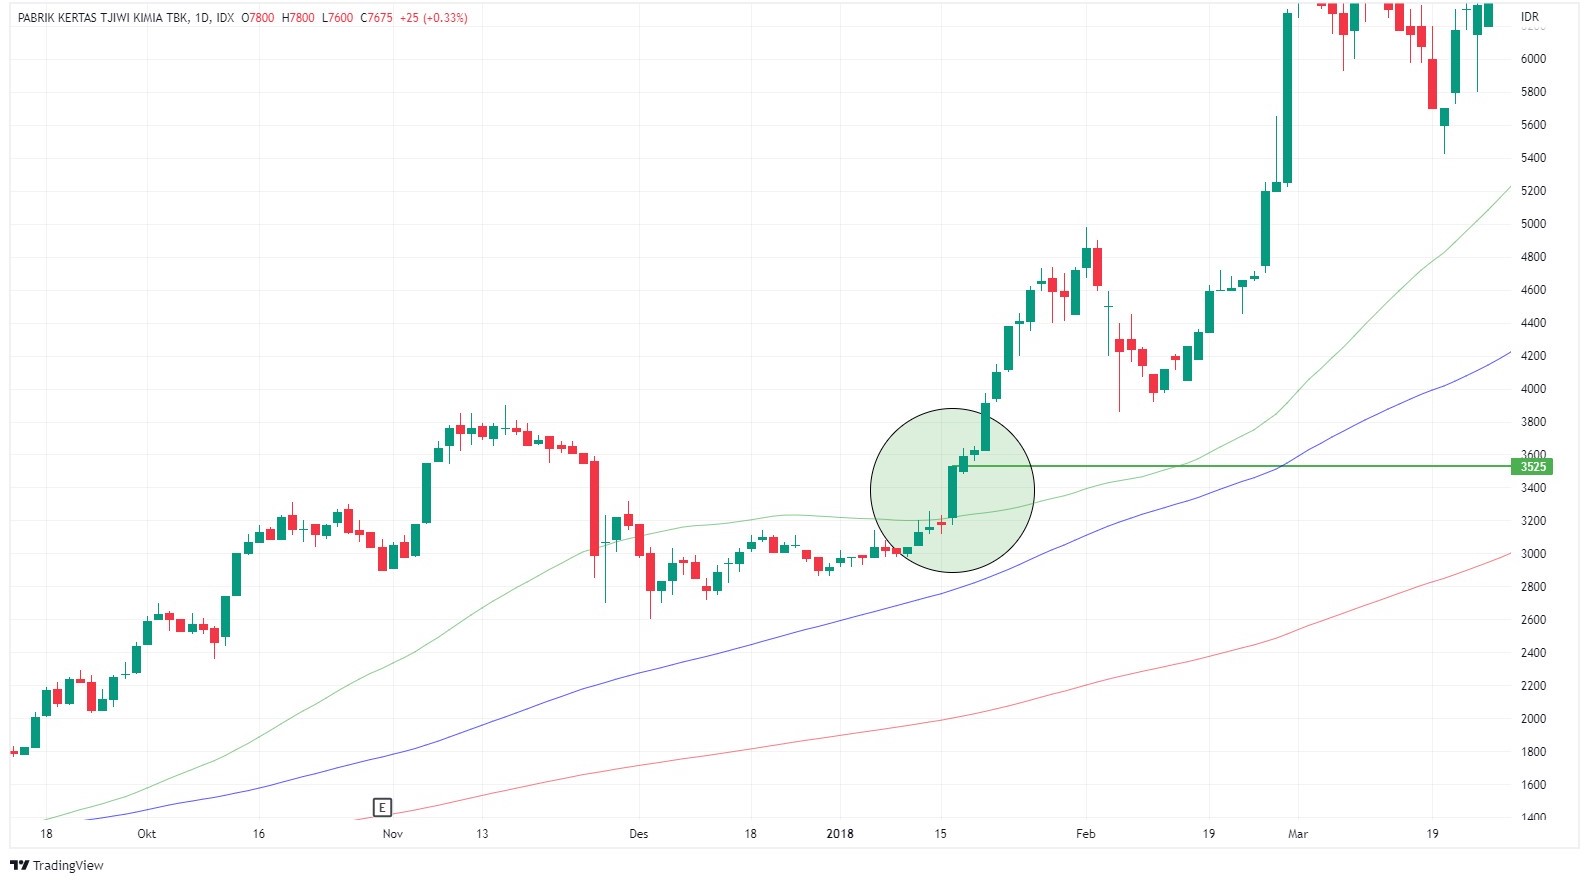
As can be seen in the chart above, it can be seen that TKIM's price is already above the 100 and 200 MA or in other words this stock is in a medium to long term uptrend phase. You can wait until price momentum breaks through the short-term MA, aka MA 50, and make purchases when the price breaks out of MA 50 (check the green circle). As long as the price doesn't reverse down the MA series, we can hold the stock. So when is the right time to sell?
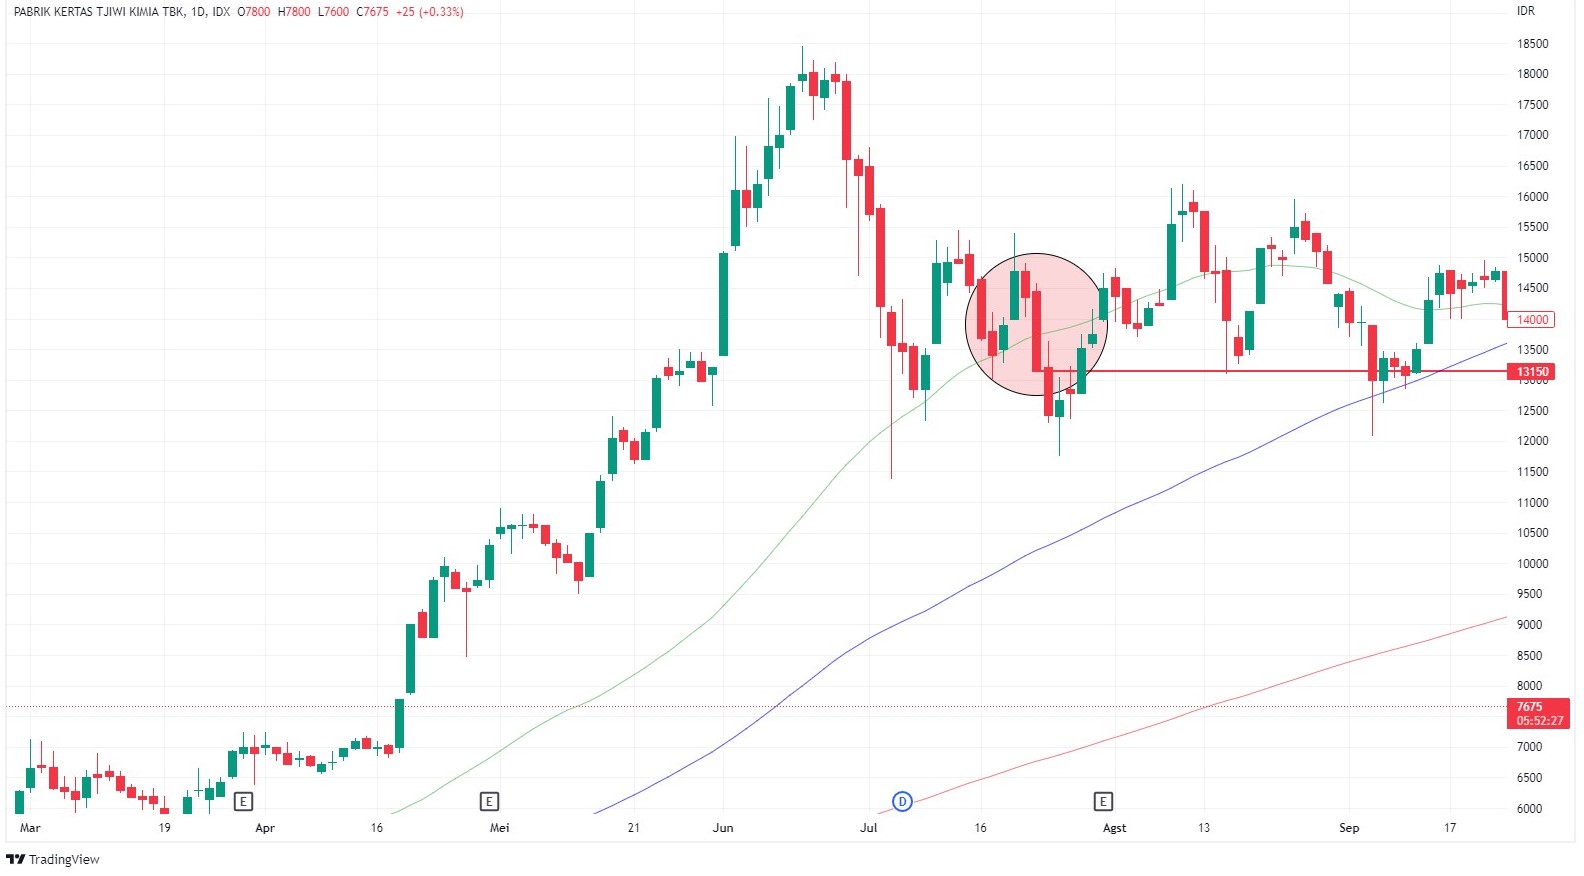
As seen in the chart above, you can take profit on TKIM when the price has broken below the 50 MA.
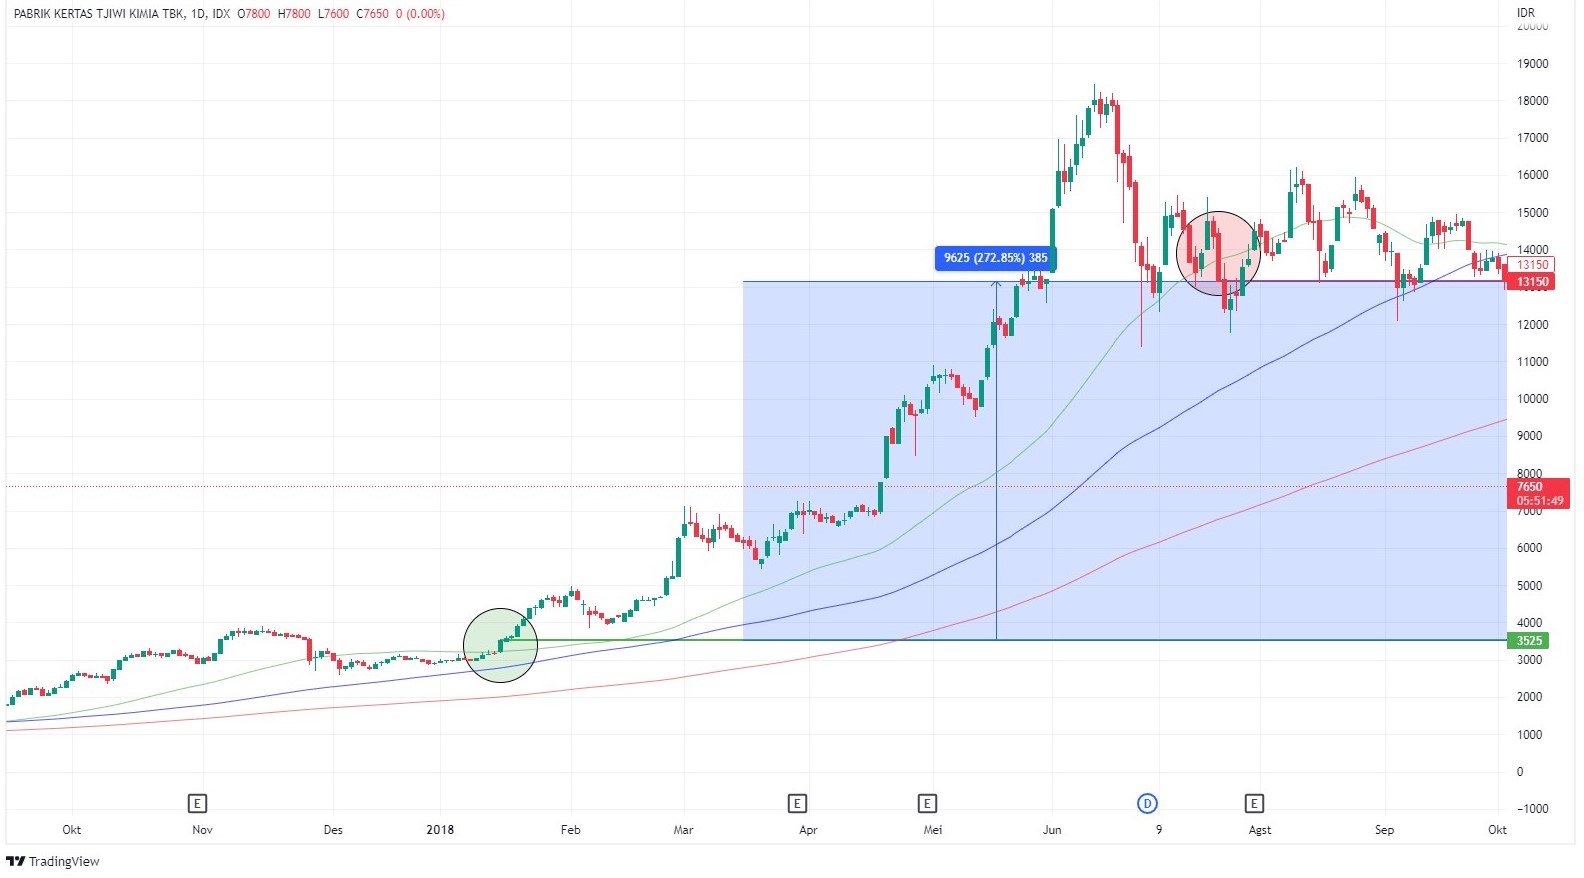
By only buying and selling based on the moving average indicator , we can already make a profit of 272.85% on this TKIM stock. A very big advantage right?
So, do you know the function of the moving average indicator ? Are you going to use this indicator too?
And don't forget, if you are trading, the key is to be consistent with what you have learned. Don't let you change your trading style just for the sake of justifying it so that the stock goes up. Even though the one who controls the market is not you.
Posting Komentar untuk "Moving Average Functions You Should Know Before You Trade Using This Indicator"